What is The Average Net Worth by Age and Why It Matters
by Joe Mahlow • Updated on Jul. 10, 2026
Average net worth by age measures how assets and debts change through each stage of life. It helps show whether finances are moving forward, flat, or backward. Many people track income and credit scores, but net worth often gives a clearer picture of long-term progress.
Net worth is the value of what you own minus what you owe. Assets may include cash, retirement accounts, investments, home equity, and vehicles. Debts may include mortgages, student loans, credit cards, and personal loans. A person with strong income can still have low net worth if debt remains high.
Age matters because financial priorities change over time. Someone in their 20s may be building savings while paying student debt. A household in its 40s may focus on home equity and retirement balances. A person near retirement may aim to protect assets and reduce risk.
Comparing net worth by age provides context that income alone cannot.
US Median Net Worth (all ages)
$192K
The number right in the middle. Half of US households have more, half have less. Federal Reserve SCF, 2022.
US Average (mean) Net Worth
$1.06M
Skewed by extreme wealth at the top. Top 10% own ~67% of all US wealth. Most people should ignore this number.
Median net worth growth 2019-2022
37%
Largest jump in 40 years of Fed surveys. Driven by rising home prices and stock market gains, not savings behavior alone.
At a Glance
The average net worth by age sounds like a benchmark. It is not - the average is pulled so high by the ultra-wealthy that comparing yourself to it is meaningless. The median is what matters. At 35-44, the median American household has $135,600 in net worth. At 45-54, it is $247,200. These numbers are dominated by home equity. Strip that out and the typical American's investable wealth is a fraction of these figures. This article gives you the real numbers, what drives them, and where your credit score fits into the picture.
CR
ASAP Credit Repair USA · Credit Repair Company · Nearly 20 Years · Registered under CROA
We see the connection between credit and net worth every day. A client denied for a mortgage at 619 who qualifies at 620 is not just getting a loan - they are gaining access to the wealth-building mechanism that drives the majority of middle-class net worth in America. The credit score is not a vanity metric. It is a net worth gate.
Average vs Median Net Worth: Why the Distinction Matters
The average (mean) net worth of US households is $1,063,700. The median is $192,700. That $871,000 gap is not a rounding error. It reflects how concentrated American wealth actually is - and why the average number tells most people nothing useful about where they stand.
When Bill Gates walks into a bar, everyone in that bar becomes a billionaire on average. The median (the person right in the middle) has not changed at all. That is exactly what happens when you average US household wealth. The top 10% of households own approximately 67% of all US wealth, according to the Federal Reserve Bank of St. Louis. Their inclusion in the average pulls it far above what a typical American household actually holds.
As CNBC Select reports, the 2022 Federal Reserve Survey of Consumer Finances found the average net worth at $1,063,700 while the median sat at $192,700. Both are true. Neither is useless. The average tells you how wealth is distributed nationally. The median tells you where the typical American household stands. For personal benchmarking, use the median.
The data source: All figures in this article come from the Federal Reserve's Survey of Consumer Finances (SCF), conducted every three years. The 2022 survey - released October 2023 - is the most recent comprehensive snapshot available. The next SCF will not be published until late 2026. The 2022 data is the current standard used by Fidelity, NerdWallet, Kiplinger, and every major financial publication.
Average Net Worth by Age: Full Data Table
Age Group
Median Net Worth
Average (Mean)
Relative Scale
Under 35
$39,000
$183,500
35 to 44
$135,600
$549,600
45 to 54
$247,200
$975,800
55 to 64
$364,500
$1,566,900
65 to 74
$409,900
$1,794,600
75 and older
$335,600
$1,624,100
Source: Federal Reserve Survey of Consumer Finances, 2022 (published October 2023). "Age group" refers to the age of the household's reference person. Median = household in the exact middle of the range. Average = sum of all household net worth divided by number of households - heavily skewed upward by high-net-worth households. The decline at 75+ reflects retirement asset drawdown, fixed income, and healthcare spending.
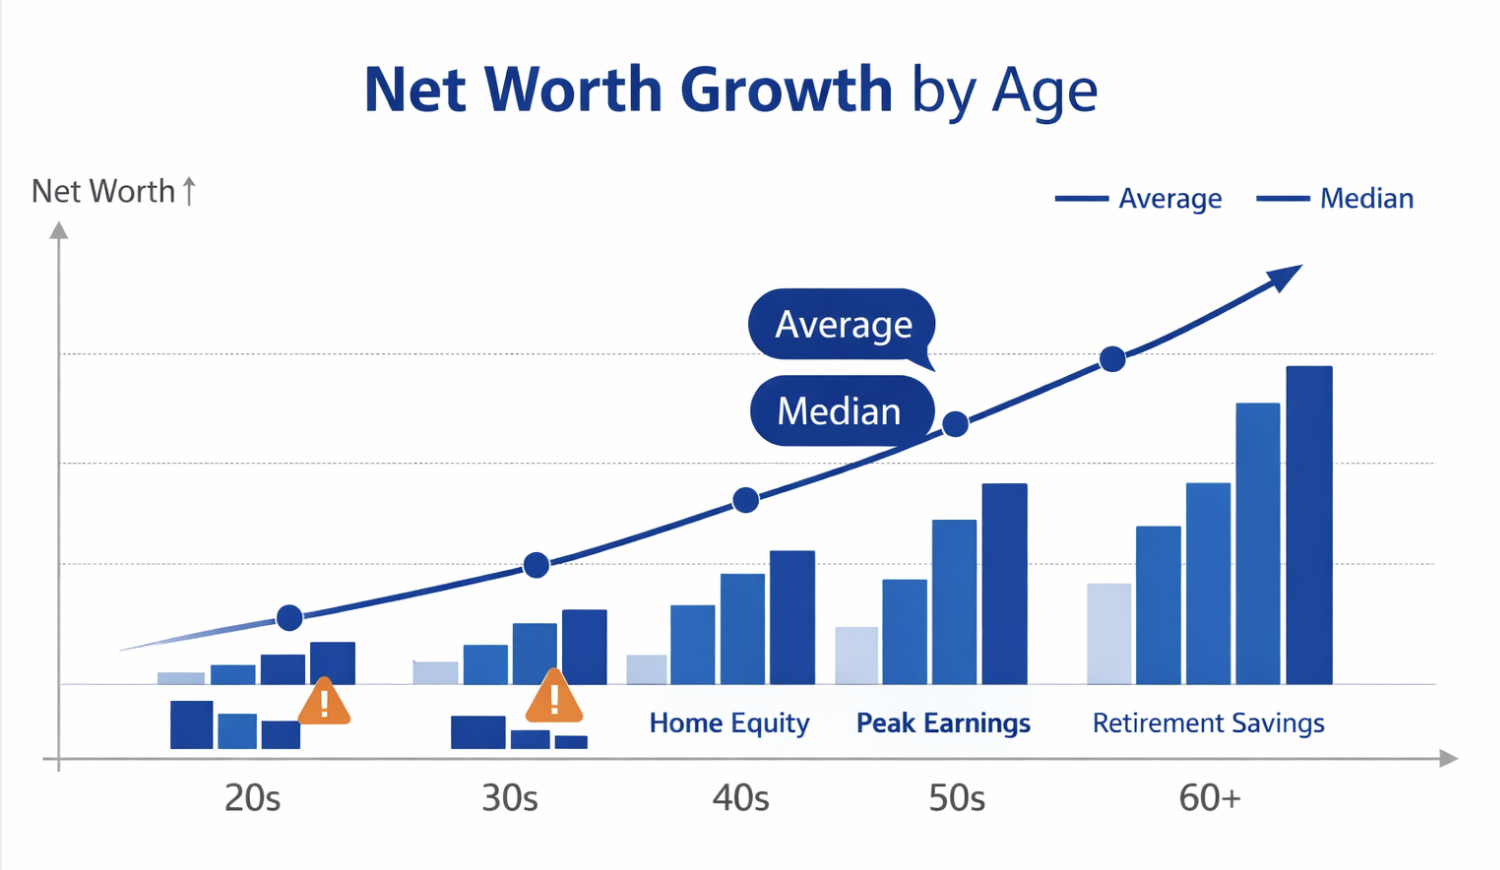
Median vs Average Net Worth by Age - US HouseholdsFederal Reserve SCF 2022
The gap between median and average widens with age because wealth concentration compounds over time. Older high-net-worth households - with large investment portfolios and business ownership - pull the average up far above where the typical older American sits. Source: Federal Reserve Survey of Consumer Finances 2022, Table 2.
What the Numbers Mean at Each Life Stage
Age GroupUnder 35
Median
$39,000
Average
$183,500
2019 Median
$13,900
Change
+181%
The $39,000 median for under-35 households jumped 181% from 2019's $13,900 - the largest percentage increase of any age group in the 2022 SCF. Home price appreciation and stock gains during 2020-2022 drove much of it. But a significant share of under-35 households still carry negative or near-zero net worth from student loans and car debt with limited assets to offset them. The typical asset at this stage is the car, which depreciates. The typical liability is student loan debt, which does not.
What most 20-somethings do not realize: every dollar of high-interest debt at this stage is a compounding net worth negative. A $25,000 car loan at 14% from a subprime lender is not just $25,000 - it is the opportunity cost of that money not invested over 30 years. Our analysis of what happens to your credit score when you mismanage debt shows that high-interest borrowing costs the average person $50,000 to $100,000 in excess interest across a lifetime - a direct subtraction from net worth.
💡At $39,000 median, most of it is likely a car (depreciating) or small retirement balance. If you own a home with any equity at 30-34, you are already well above the median for this group.
Age GroupAges 35-44
Median
$135,600
Average
$549,600
2019 Median
$105,000
Change
+29%
The 35-44 group is where the homeownership divide becomes visible. Homeowners in this bracket hold most of their net worth in home equity - a mortgage paid down over 5-10 years plus appreciation. Renters in the same bracket typically have significantly less net worth because they have not accumulated that asset. The average at $549,600 looks high, but the average is pulled by high earners who bought homes in 2012-2018 and watched values double.
This is also peak student loan and child-rearing cost territory. Many households in this range are paying down multiple obligations simultaneously, which slows net worth growth even on strong incomes. As Kiplinger notes, being at or above the median of $135,600 in this age group means you are ahead of at least half of your peers - regardless of how the average makes that feel.
💡One important note from the data: the 40-44 sub-bracket sometimes shows a slight median dip versus 35-39 - researchers attribute this to peak childcare, housing upgrade costs, and career transitions that temporarily compress liquid net worth.
"I'm 38 and just checked - my net worth is about $112,000. I own a home with roughly $85,000 in equity and have $27,000 in a 401k. My wife and I were convinced we were way behind everyone else. Turns out we're basically at the median. The media makes it sound like everyone is sitting on $500K by 40. They're not."
r/personalfinance · net worth check-in discussion, 2025$112K at 38. $85K home equity + $27K retirement. At median for 35-44. Perception gap between media framing and actual data is the most common theme in net worth threads.
Age GroupAges 45-54
Median
$247,200
Average
$975,800
2019 Median
$168,800
Change
+46%
Peak earning years collide with peak debt paydown in this bracket. Mortgages have been running for 10-20 years. Some borrowers have refinanced their way into lower payments or paid off homes entirely. Retirement accounts have compound growth working in their favor. The 2022 median of $247,200 reflects a household that has been building consistently - not dramatically - for two decades.
The problem is the gap between the median ($247,200) and what financial planners say you should have for retirement readiness at this stage. By 50, many rules of thumb suggest 6 times salary in retirement savings alone. At a $75,000 income, that is $450,000 - nearly twice the median net worth for this entire age group. Most Americans in their late 40s and early 50s are behind target on retirement savings even while sitting at or above the net worth median.
💡Home equity is doing heavy lifting at this stage. Excluding it, the investable net worth of the median 45-54 household is significantly lower - one reason financial planners treat retirement savings and total net worth as separate conversations.
Age GroupAges 55-74
Median at 55-64
$364,500
Median at 65-74
$409,900
Average at 55-64
$1,566,900
Average at 65-74
$1,794,600
These are the peak net worth years for most Americans. Children have left home, mortgages are paid or nearly paid, and retirement accounts have had decades of compounding. The 65-74 median of $409,900 is the highest of any age group. The slight decline at 75+ ($335,600) reflects what economists call the drawdown phase: living expenses are paid from savings, Social Security, and retirement distributions while new wealth accumulation slows or stops.
The average for 65-74 households is $1,794,600 - skewed by the roughly 12% of this age group who own businesses, large investment portfolios, and multiple real estate properties. NerdWallet's analysis confirms that even in this wealth-peak bracket, the median tells a very different story than the average.
💡Retirement assets accounted for 34% of all US household financial assets at the end of 2025, per the Investment Company Institute. Total US retirement assets reached $49.1 trillion at year-end 2025 - concentrated among this age group.
Why You Need to Know Your Net Worth
Net worth is not a score to win. It is a diagnostic. It tells you whether your debt, income, and assets are moving in the same direction - or working against each other.
Most people track income and ignore net worth. That is backwards. Someone earning $150,000 per year with $200,000 in consumer debt and $0 in retirement savings has a lower net worth than someone earning $60,000 who has been contributing to a 401(k) for 15 years and paid off their car. The income number looks better. The net worth tells the truth.
Three practical reasons to track net worth by age:
1. Mortgage qualification. Lenders evaluate debt-to-income ratio and asset reserves. Your net worth components - specifically your cash and retirement accounts - determine whether you have the reserves needed for a down payment and closing costs. A household at the median net worth for their age with most of it in home equity may still not qualify for a move-up mortgage without additional liquid assets. Our guide on credit repair for first-time home buyers covers exactly what lenders look at beyond the credit score, including asset reserves and how they connect to net worth.
2. Emergency vulnerability. Net worth includes illiquid assets like home equity that cannot pay a car repair bill tomorrow. The median under-35 household with $39,000 in net worth mostly concentrated in a car they are still paying off has very little buffer against a financial shock. This is why understanding the composition of net worth - not just the total - matters as much as the number.
3. Retirement trajectory. Tracking net worth annually against the median for your age group gives you a rough read on whether you are building at a normal pace, ahead, or behind. Being at the median is not failure. But knowing you are at the 25th percentile at 55 - when the window to catch up is narrowing - creates useful urgency.
The Credit Score-Net Worth Connection Nobody Talks About
Your credit score does not appear anywhere in your net worth calculation. That makes it easy to treat as a separate problem. It is not. Credit score determines your borrowing cost, and borrowing cost directly subtracts from net worth over time.
Loan Type
Good Credit Rate
Poor Credit Rate
Total Extra Interest
Net Worth Impact
$300,000 Mortgage (30yr)
6.5%
8.5%
+$129,726
-$129,726
$35,000 Auto Loan (5yr)
5%
16%
+$9,800
-$9,800
$15,000 Credit Card (carried 3yr)
18%
29%
+$5,100
-$5,100
Estimated lifetime total
Normal borrowing cost
High-rate borrowing cost
+$144,626+
-$144,626 net worth
Illustrative calculation based on typical loan amounts and rate differentials between 780+ credit score and 620 credit score borrowers. Mortgage example: $300K at 6.5% vs 8.5% over 30 years. Auto: $35K at 5% vs 16% over 60 months. The $144K+ figure is conservative - it excludes compound investment returns on the money not spent on excess interest. Sources: CNBC Select credit score impact data; ASAP Credit Repair client rate data; Federal Reserve mortgage rate spreads by credit tier.
A credit file with inaccurate negative entries is not just a credit problem. Every year you carry a 610 score instead of a 660 score costs you money on every loan you hold. That cost comes directly out of net worth. As settling debts affects your credit score differently depending on the method - and the wrong approach can leave a derogatory entry in place while reducing the balance - understanding how each action affects the score is part of managing total net worth, not just credit.
The home equity trap. Most middle-class American net worth lives in home equity. The 2022 SCF shows that excluding home equity, the median American's net worth falls from $192,700 to roughly $57,900. That means the typical household cannot access most of their net worth without selling their home or taking a HELOC. Track liquid net worth separately. Know the difference between total net worth and investable net worth. They require different financial strategies.
Frequently Asked Questions
What is the average net worth by age in the US?
From the Federal Reserve's 2022 Survey of Consumer Finances - the most recent data available: Under 35: median $39,000 / average $183,500. Ages 35-44: median $135,600 / average $549,600. Ages 45-54: median $247,200 / average $975,800. Ages 55-64: median $364,500 / average $1,566,900. Ages 65-74: median $409,900 / average $1,794,600. Ages 75+: median $335,600 / average $1,624,100. The median is the more meaningful benchmark for most households because the average is heavily skewed by the wealthiest 10%.
Why is the average net worth so much higher than the median?
Because the top 10% of American households own approximately 67% of all US household wealth, according to Federal Reserve Bank of St. Louis data. A small number of households with multi-million-dollar net worth pull the average (mean) far above where the typical household actually sits. The overall average is $1,063,700. The median is $192,700. That $870,000 gap is not a data error - it is an accurate reflection of how concentrated wealth is in the United States.
What net worth should I have at 40?
The Federal Reserve median for the 35-44 age group is $135,600. Being at or above that number means you are ahead of at least half of all US households in your age bracket. Some financial planning guidelines (like Fidelity's rule of 3x salary saved by 40) apply specifically to retirement savings, not total net worth. If you own a home with equity, that counts toward your total net worth even though it is not retirement savings. At 40, being above the $135,600 median places you in the top half for your age group.
What percentage of Americans have a negative net worth?
Federal Reserve data shows a meaningful share of younger households carry negative net worth - meaning liabilities exceed assets. Student loan debt, car loans, and credit card balances with limited offsetting assets create this condition. The 2022 SCF showed the bottom 25% of households had near-zero or negative net worth. Among under-35 households specifically, a significant portion have negative net worth due to student loans and early-career debt loads. The 2019-2022 period reduced this share as some households paid down debt or accessed home equity gains.
How does credit score affect net worth?
Credit score determines your borrowing rate, and your borrowing rate determines how much of your income goes to interest instead of asset-building. A borrower with a 780 score paying 6.5% on a $300,000 mortgage pays approximately $342,000 in total interest. The same borrower at 620 paying 8.5% pays approximately $471,000 - a $129,000 difference over 30 years. That $129,000 represents net worth not accumulated. The same math applies to auto loans, credit cards, and personal loans. Across a lifetime of borrowing, a 100-point credit score difference can cost $100,000 to $150,000 in total excess interest.
Why does median net worth drop after age 74?
The drop from $409,900 at ages 65-74 to $335,600 at ages 75+ reflects the drawdown phase of retirement. Households in this group are living on retirement distributions, Social Security, and fixed income rather than accumulating new assets. Healthcare costs increase. Some households move from owned homes to assisted living or senior communities, liquidating home equity in the process. The decline does not indicate financial failure - it indicates that retirement savings are being used for their intended purpose.
ASAP Credit Repair USA · Registered under CROA
Your Credit Score Is a Net Worth Lever - Check Where It Stands Now
Every percentage point saved on a mortgage, car loan, or personal loan stays in your pocket instead of going to a lender. A free 3-bureau audit shows exactly what Equifax, Experian, and TransUnion are reporting - and identifies every inaccurate entry that may be suppressing your score and costing you money on every loan you hold.
How to Build Clean Credit Files Across All 3 BureausA clean credit file across Equifax, Experian, and TransUnion is the foundation for accessing lower borrowing rates - which directly affects long-term net worth. This covers the 4-step dispute process, what errors qualify for removal, and why filing all three bureaus simultaneously matters for getting results in 30 to 45 days rather than 90 to 135.
Auto Loan Defaults in Phoenix: What's the Timeline Before RepoAn auto loan default at a subprime rate is a double net worth hit: the car loses value while the high-interest loan balance erodes the asset's contribution to your balance sheet. This covers Arizona's repo timeline, what credit notations a default generates, and why the credit damage - which stays for 7 years - matters more to long-term net worth than the vehicle itself.
Top 7 Emergency Loan Providers for Low Credit Scores in Harris CountyEmergency loans at 25-35% APR are a net worth negative - expensive money that delays savings and compounds debt. But they are sometimes unavoidable. This covers the lenders who serve Houston borrowers with scores under 580, which ones report to all three bureaus (making the loan a credit-building tool rather than just a cost), and how the sequence of paying off an emergency loan affects net worth recovery.
Disclaimer: This article is for general educational purposes. All net worth data is sourced from the Federal Reserve's 2022 Survey of Consumer Finances, published October 2023. The 2025 SCF data will not be available until late 2026. Interest rate comparisons are illustrative. Individual borrowing costs vary by lender, loan type, and applicant profile. ASAP Credit Repair USA is registered under the Credit Repair Organizations Act. Credit score improvement not guaranteed.
Average Net Worth by Age (Summary)
Average net worth by age helps measure how wealth tends to build over time. It gives context to your financial position and can show whether your assets are growing faster than your debts. Many people focus on income, but income alone does not explain financial strength. Net worth usually gives a better long-term view.
Net worth is calculated by subtracting total liabilities from total assets. Assets can include checking and savings balances, retirement accounts, investments, home equity, and business ownership. Liabilities often include mortgages, student loans, credit cards, auto loans, and personal debt.
Why Age Benchmarks Matter
Financial priorities shift with age. A person in their 20s may be paying student debt and building an emergency fund. Someone in their 30s may be balancing mortgage payments, child expenses, and retirement savings. Households in their 40s and 50s often focus on peak earning years, investing, and reducing debt before retirement.
That is why comparing net worth by age is more useful than comparing yourself to all households combined.
Average vs Median Net Worth
Many online articles use average net worth figures. The problem is that averages are often pulled higher by top earners and high-asset households. Median net worth usually gives a more realistic benchmark because it reflects the midpoint household.
According to data from the Federal Reserve Survey of Consumer Finances, wealth distribution in the United States is uneven. This means a small percentage of households hold a large share of assets, which can distort average figures.
Estimated Net Worth by Age Group
While exact numbers change over time, this general pattern is common:
Age 25 to 34 Many households are in the early accumulation phase. Savings may be modest, and debt balances can still be high from school or early borrowing.
Age 35 to 44 Net worth often rises as income grows, retirement balances build, and home equity increases.
Age 45 to 54 This is often a key growth decade. Peak earnings years can increase savings and investments, though family costs may still be high.
Age 55 to 64 Many households focus on reducing debt and preparing for retirement withdrawals.
Age 65 and older Net worth may remain strong through home equity and retirement assets, though spending patterns often shift toward preservation.
Why Your Net Worth May Differ
Your number may be above or below age averages for reasons that have nothing to do with failure or success. Major factors include:
Cost of living in your city
Student loan balances
Divorce or family support obligations
Business ownership risk
Medical costs
Career timing or layoffs
Real estate market gains or losses
In financial reviews we see, two people with the same salary can have very different net worth because one saves consistently while the other carries high-interest debt.
How to Improve Net Worth at Any Age
The fastest path to better net worth is usually not chasing higher income alone. It is improving the gap between what you own and what you owe.
Focus on these steps:
Pay down high-interest debt first
Build emergency savings
Contribute to retirement accounts regularly
Avoid lifestyle inflation after raises
Increase assets that grow over time
Review liabilities each quarter
Why You Need to Know Your Number
Knowing your net worth helps with real decisions. It can guide home buying, retirement planning, debt payoff strategy, and investment risk. It also helps you spot progress that income alone may hide.
A household earning less but carrying little debt may be stronger than a higher-income household with heavy obligations.
Average Net Worth Takeaway
Average net worth by age is a benchmark, not a scorecard. It can help you measure progress, but it should not define success. Local costs, family size, career timing, and debt history all shape the numbers.
A better use of net worth data is trend tracking. If debt is falling, assets are growing, and savings habits are improving, progress is happening even if you are below the average.
Use age benchmarks to guide decisions, not judge yourself. The strongest net worth plan is the one that keeps improving year after year.